Creating Flare Debug Outputs
Introduction
MadCap Flare makes a great job combining all the different underlying single-source authoring bits and pieces, as well as other standard HTML components comprising any given project, so they are seamlessly rendered in the resulting output.
There are times, however, when it is useful to highlight those underlying elements in the resulting output in order to support the process to check for potential defects and fix them.
Jump Start
Those willing to cut to the chase and get started straightaway should read the Disclaimer section before fast-forward right to the Implementation Cheat Sheet section.
Overview
In software parlance, defects are known as bugs, so debugging is the process to iron them out.
To help spot and fix possible bugs, software developers usually create an especial version or debug build boasting particular features aimed to streamline the debugging process. For example, an application may include verbose and code-related data in any error message meant for testers and programmers or a video game debug version may display on screen the audio filenames being played in order to assess whether any of them is incorrect — To some extent, these debugging techniques can be applied to Flare outputs.
Once a Flare project debug version is implemented, some strings in the output will stand out from the rest of the text by being rendered in different formats, depending on which underlying component type they stem from, as in the following example:

When creating a debug output, the basic idea is to implement style classes and supporting tags to the intended single-source authoring elements and other regular HTML tags. Such elements covered in this document are:
- Project-wide Variables
- Target Overriding Variables
- Snippets
- Filenames
- Hard-Coded Page Breaks
- Images
- Conditional Text
Intended Audience
The guidelines described in this piece of writing are meant for MadCap Flare users. These techniques were crafted having Flare output localized versions testing and troubleshooting in mind but content creation teams may also avail of them. They are pretty basic but they do require certain knowledge of Cascading Style Sheet editing and Regular Expression procedures, so software programmers and engineers would be the most likely candidates to implement such techniques.
Authors, project managers (authoring and localization), translators, and proofreaders dealing with MadCap Flare projects, might find this content useful in order to, at least, make precise requests for any tech-savvy team member, helping soul, or peer to implement the described tweaks.
Initial Considerations
As in any software development process, better safe than sorry is the recommend principle to go by.
The following guideline has been tested and works reliably in most scenarios, but caution is paramount to safeguard the production Flare project by making backups or, if using a source control system, following the recommended practices.
Since the goal of creating a debug version is to fix potential issues, it is highly recommended to plan ahead the subsequent fixing steps. Among other decisions, the plan should establish whether the final fixes tested in the debug version should be replicated in the production version or just in the debug version, which will become the production version.
Although Regular Expressions are not ideal for parsing HTML code, they can be used to achieve the desired results with a high degree of compliance. Notepad++ is the application used to illustrate the search and replace in files procedures, although they can be carried out using any text editor or development application supporting such functionality.
Implementation Cheat Sheet
The process to create a debug output can be summarized in four stages:
- Download or create the debug CSS file
- Link the above CSS file to the relevant existing CSS file or files via @import rule
- Run the search and replace in files Regular Expression procedures
- Update the Medium value in the Flare target file
These stages are further discussed in the following sections.
Linking Debug.css
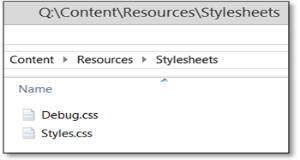
The debug styles described below are found in Debug.css, which can either be created from scratch or downloaded. This debug CSS file can be saved in any available folder but perhaps the most convenient place is the same folder than the existing CSS files, typically under \Content\Resources\Stylesheets.
The debug styles are then implemented in the Flare project by linking Debug.css to the existing applicable project CSS file or files via @import rule1. The example below shows how to link Debug.css to Styles.css, either with a text editor like Notepad++ or Flare Internal Text Editor, or within Flare Stylesheet Editor graphical user interface:
- Code editing - Open the target CSS file with the preferred text editor and add the rule @import url('Debug.css'); towards the top of the target CSS file, Styles.css in this case
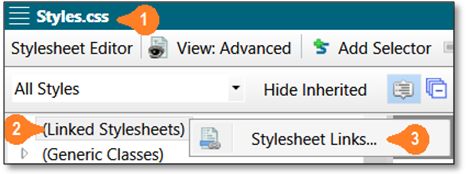
- In Flare2 – Open the target CSS file, Styles.css 1 in the example, with the Stylesheet Editor, right-click on (Linked Stylesheets) 2 list item and select Stylesheet Links… 3 from the contextual menu
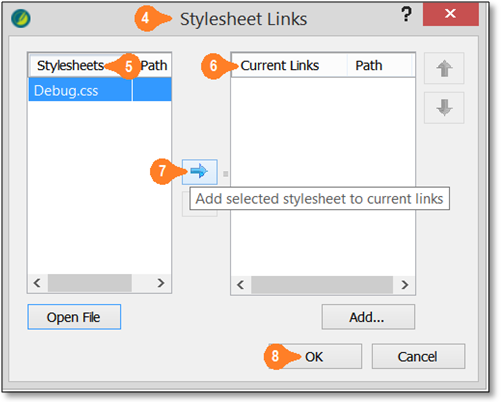
In the Stylesheet Links 4 popup dialog, select Debug.css from the available Stylesheets 5 list and add it to the Current Links 6 list by clicking on the right-pointing blue arrow 7 followed by OK 8
The newly linked CSS should now be listed under (Linked Stylesheets)
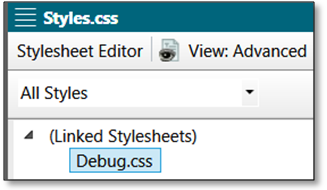

In this example, both CSS files are found under the same folder so the path to Debug.css is not required.
The following sections cover the particulars on how to add the supporting tags and describe their associated style classes found in Debug.css.
Project-wide Variables
MadCap Flare includes its own styles and properties3 to format the look of single-source authoring elements and features within the development environment at design time, but some of those built-in styles will also be shown in the generated output. Such is the case of the MadCap|variable selector, so it does not require supporting tags.
Therefore, Debug.css includes the said MadCap|variable selector and a declaration which will display variables in dark green:
The resulting output will look like this:
This is a variable as rendered in the output
To further highlight the variables and make them searchable in the output, the following pseudo-class selectors enclose the variable in orange square brackets:
        MadCap|variable::before {
            content: "[";
            color: orange;
        }

        MadCap|variable::after {
            content: "]";
            color: orange;
        }
This will show variables as follows:
This is a [variable] as rendered in the output
Among other potential benefits, this bracket enclosing approach is especially useful in case two or more variables are placed side-by-side. For example, a string showing as
This is a double variable as rendered in the output
may include two variables:
This is a [double] [variable] as rendered in the output
In translated versions, text inversion might require swapping the order of the variables in the target language:
Esto es una [variable] [doble] según aparece en el resultado
Target Overriding Variables
MadCap Flare offers the possibility to override global variable values included in an output by editing the values of such variables in the target .fltar file generating that output4.
When reviewing Flare outputs for potential defects, it is handy to easily tell between both variable types as it can significantly reduce the time to pinpoint the source of a potential flaw.
In Flare localization processes, if these target variables are overlooked the untranslated strings will produce unwanted results. Say, for example, a project-wide variable should be replaced in each generated output type by its associated overriding variable: “Letter size”, “A4 size”, etc. Left untranslated, these target variable values will appear in the otherwise translated output.
A simple and immediate way to flag these instances of overridden variables is to manually add an eye-catching control character to the target variable by means of Flare Target Editor as shown below:

In this example the control character used is the % percentage sign. Prior to selecting a discretionary control character, it is recommended to check all existing variables, project-wide and target, and choose an appropriate eye-catching control character, like @, #, or $, to list a few.
The added character will be rendered alongside the variable debug closing character as explained in section Project-wide Variables above, that is %], making it conveniently searchable in the resulting outputs, which would look like this:
This is a [target%] [variable] as rendered in the output
However, implementing this debug feature this way has at least two drawbacks:
- It can be cumbersome in situations involving a fair amount of targets and variables to update
- The Target Editor displays all project-wide variables, including those that don’t require editing, which makes it tricky to tell from each other. In the example above, Variable1 and Variable2 definitions are global variables that should remain unchanged
A workaround to tackle these drawbacks is to edit the underlying .fltar file by performing a find and replace in file procedure.
Unlike Flare Target Editor, a .fltar file includes just the overriding variables. In the above example, the original .fltar file <Variables> section would look like this:
<Variables> <Variable Name </Variables>
Therefore, the control trailing character can be implemented by running a find and replace in files procedure with the following settings, whereas “%” should be swapped for the control character of choice:
Snippets
MadCap Flare does not support snippet formatting through CSS as it does for variables. To tackle these single-source authoring elements from a debugging viewpoint, the .flsnp snippet files need to be edited to include supporting tags and an associated CSS class.
Firstly, let’s make sure the related project is not opened in Flare. MadCap recommends closing Flare5 but just shutting down the project should do the trick.
Next, run a normal search and replace in files procedure6 searching for the <body> tag in all the Flare project .flsnp snippet files, replacing each instance with
In Notepad++, the Find in Files dialog would look like this:
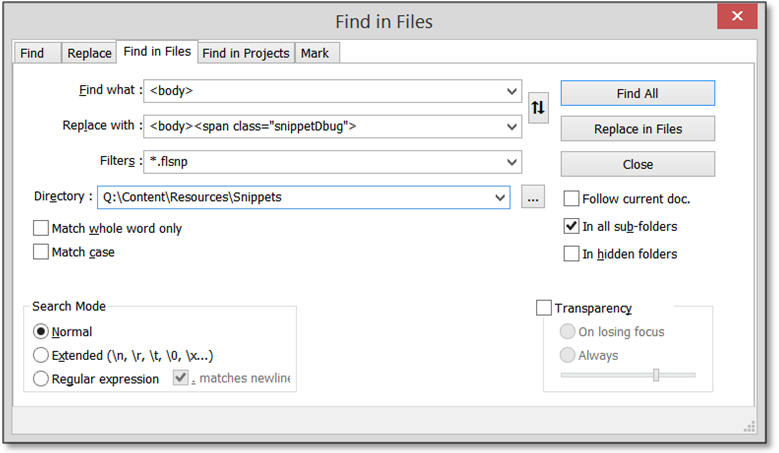
Then, add its corresponding closing tag running a normal search and replace in files procedure with the following settings:
The above find and replace options might require to be adapted to each project. The snippet files are typically found under \Content\Resources\Snippets path but they might be included in other folders. Running the search on a higher directory but limiting the search scope by filtering on *.flsnp files, as shown in the examples above, should suffice.
Here is an example of a resulting .flsnp file:

The related snippet class and pseudo-classes in Debug.css are these:
    .snippetDbug {
            color: purple;
        }

            .snippetDbug::before {
                content: "|";
                color: yellow;
            }

            .snippetDbug::after {
                content: "]";
                color: yellow;
            }
The resulting output would look like this:

Filenames
Including the underlying filenames in PDF outputs can be very handy. It can be used in several ways, like selecting the required filename in the PDF file, copying it to the Clipboard, and pasting it in Flare Quick Launch bar textbox to quickly access that file.
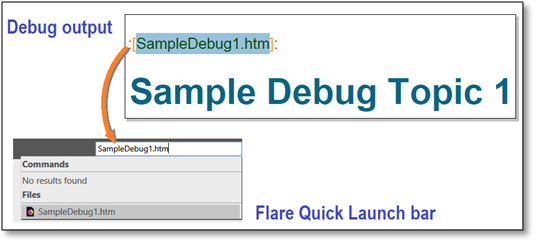
Another possible scenario is when translators and proofreaders working on a Computer-Assisted Translation tool need to check how a string looks like in the output: finding the file being translated or proofed in the debug output is immediate.
A simple approach to implement this debug option is to append the Flare built-in System.Sourcefile7 variable to the <body> tag in all topic files.
This can be achieved by running a normal find and replace in files procedure searching for the <body> tag in all the Flare project .htm/.html topic files, and replacing each instance with
The Notepad++ Find in Files dialog would look like this:
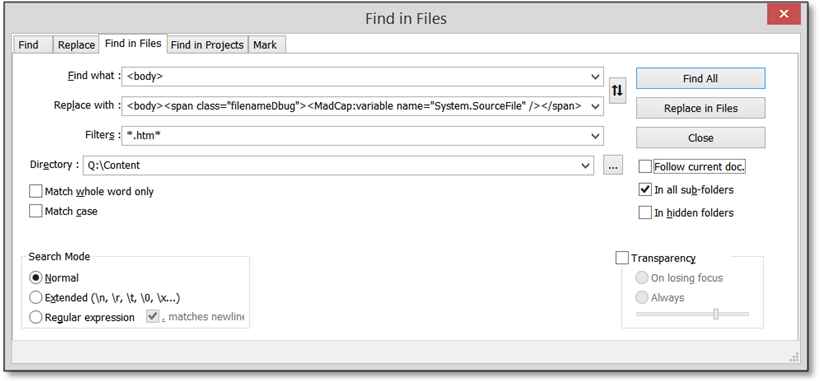
Although some rendered styles are overridden by those of variables, filenameDbug class still supports related pseudo-classes. The styles inside the Debug.css debug media section are these:
    .filenameDbug {
        font-size: .7em;
        display: inline;
    }

        .filenameDbug::before {
            content: " :";
            color: red;
        }

        .filenameDbug::after {
            content: ":";
            color: red;
        }
Besides, a selector in the general section of Debug.css, outside the @media debug query, hides the filename when a non-debug version is built:
Another option is to concatenate the filename to all topic top level header tags, like h1, h2, etc. depending on the topic file design. The resulting code would look like this:
<h1>
    Sample Debug Topic 1
</h1><span class="filenameDbug"><MadCap:variable name="System.SourceFile" /></span>
To do so, the applicable find and replace strings would be as follows:
Whereas </h1> closing tag should be replaced by the desired header tag: </h2>, </h3>, etc.
This top header concatenation option could be appropriate for large topics files with several top header tags: in case an eventual issue is detected and the offending file needs to be edited, the filename will be shown at the related section and it won’t be necessary to scroll all the way back to the start of the rendered file in the output.
Hard-Coded Page Breaks
Content blocks marked to avoid or force page breaks dynamically (soft-coded) sometimes cause odd page breaks due to translated text expansion. To tell those apart from fixed hard-coded page breaks –also known as manual page breaks– set during content creation, it can be useful to reveal such hard-coded page breaks in debug outputs to appropriately tackle them in the Flare project in case of any issue.
The built-in Flare MadCap|pageBreak selector is another exception when it comes to displaying proprietary styles in the resulting output. So, as it is the case for snippets, styling hard-coded page breaks for debugging purposes does not require supporting tags.
Debug.css includes the following selectors in the debug media query section to achieve the intended results:
    MadCap|pageBreak {
        display: inline;
    }

        MadCap|pageBreak::before {
            content: "--PgBrk--";
            color: coral;
            font-size: .6em;
        }
The generated output would look like this:

Debug.css also includes the following selector in the general section, outside the debug media query, to conceal the hard-coded page break telltale --PgBrk-- string for non-debug builds:
Images
Outputs including a significant number of all kinds of images might require a fair amount of testing and editing of those images, especially in localized versions. To deal with any issue related to images, it is quite handy to include their filename in the debug output, for instance:
- Makes it easier to access image files among a myriad of image files tacked under a several layers deep directory
- Helps in making further references to any given image file when, for example, logging an issue with that image or requesting an edit from the artwork editors
A technique to accomplish such goal consists of concatenating the src attribute value of an image tag to the tag itself. For example: given the image tag
the src value ../figure.jpg is appended to the closing /> string:
The appended filename can be further styled by enclosing it in a <p> paragraph tag with its appropriate class. To achieve such results, run the following regular expression8 text replacement procedure:
In Notepad++, make sure the Regular expression option in the Search Mode group box is selected.
The resulting underlying code would look like this:
<img src="../figure.jpg" /><p class="imgDbug">../figure.jpg</p>
Debug.css includes two selectors for this class in the supporting tag, one in the general section to hide the image path when a non-debug version is built:
and one within the media debug query section:
An example of generated output might look like this:

Conditional Text
Similarly to other single-source elements, it might be useful to highlight conditional text in the output. To do so, the appropriate style class needs to be implemented in the conditional tag by either running a Notepad++ find and replace procedure or via Flare Find Elements9 feature. The following lines describe each process:
- Find and Replace – The desired tag editing can be achieved by running a normal find and replace in files procedure with the following settings:
Find:<MadCap:conditionalTextReplace with:<MadCap:conditionalText class="conditionDbug"Filters:*.htm*;*.flsnp
- Within Flare
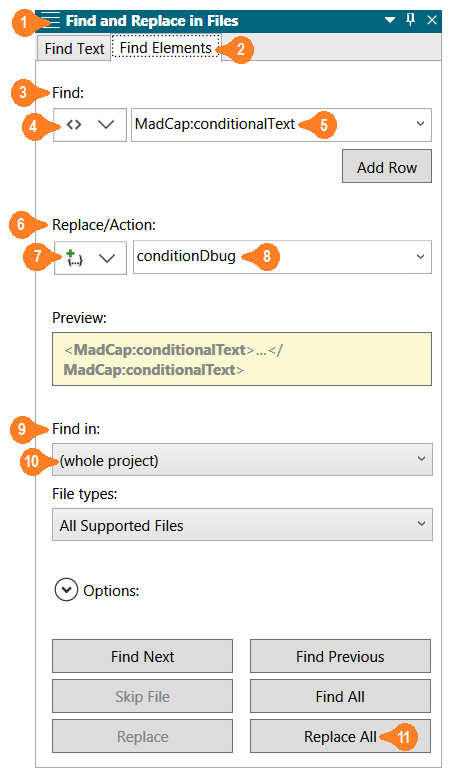
- In the Find and Replace in Files 1 pane, access the Find Elements 2 tab.
- From the left dropdown box under the Find 3 section, select Tag 4 and then type or select MadCap:conditionalText 5 from the right-hand side dropdown box
- Under the Replace/Action 6 section, select Add Class 7 and type conditionDbug 8 as shown in the image below.
- In the Find in 9 section, select (whole project) 10
- Finally, click on the Replace All 11 button.
The resulting Find Elements panel should look like this:
The Debug.css selectors related to conditional texts are these:
    .conditionDbug {
        background-color: lightcyan;
    }
        .conditionDbug::before {
            content: "{";
            color: coral;
        }

        .conditionDbug::after {
            content: "}";
            color: coral;
        }
Which will render conditional texts this way:

Class Declarations
The debug style selectors and their declarations included in Debug.css and detailed above, were chosen to highlight elements in the resulting output but, at the same time, make changes as subtle as possible so the overall output layout looks similar to its original counterpart. Needless to say that the suggested options can be changed to meet the desired results.
Depending on the intended use, the debug output can be reviewed but also searched on. If, for example, variables need to be checked, a search on “[” will find all such elements in the debug output; similarly, a search on “|” will retrieve all instances of snippets, and so on.
Debug Build Option
Once the debug CSS has been linked and the supporting tags implemented, the option “debug” should be selected in the Medium drop-down list for the applicable .fltar target file. This option is found at Advanced tab > Stylesheet Medium section10, as shown in the image below:
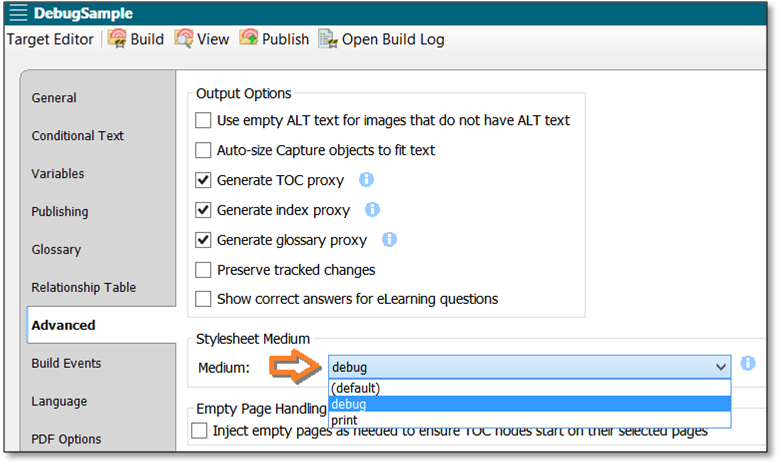
This setting applies the styles included in the Debug.css @media debug section to the generated output. To build a regular non-debug output, switch this option back to its original value.
Downloads
The debug Cascading Style Sheet file Debug.css is available for download.
Besides, a sample debug Flare project including the said CSS is also available for download.
Disclaimer
The information and guidelines included in this document are offered for general information purposes and, although every effort has been made to ensure they serve the purpose, given the variety of potential code designs the results cannot be guaranteed under all condition and the author assumes no liability or responsibility of any kind over any erroneous, bogus, or unexpected results. It remains the user's responsibility to properly apply and adapt these guidelines to each situation.
References
1 – Mozilla Developer Network Import at-rule
2 – MadCap Flare Linking stylesheets
3 – MadCap Flare own styles and properties
4 – MadCap Flare Overriding Variable Definitions in Targets
5 – MadCap Flare Editing snippets
6 – Notepad++ dialog-based searching
7 – MadCap Flare System variables
8 – Wikipedia Regular Expressions || Jan Goyvaerts's Regular Expressions site
9 – MadCap Flare Find Elements
10 – MadCap Flare Associating a medium with a target